Centralized Logging for Kafka on Kubernetes With Grafana, Loki, and Promtail.
If there are multiple zookeeper and Kafka pods, a single window would be a boon for administrators. Grafana provides Loki and Promtail this functionality.
Join the DZone community and get the full member experience.
Join For FreeIntroduction
In one of my another articles, I discussed how to set up strimzi (also known as Kafka on Kubernetes) on minikube. Also, we discussed how to set up Grafana and Prometheus to fetch metrics from Kafka and zookeeper instances. But wouldn't it have been more helpful and more administrator-friendly if Grafana could also be used to monitor logs of all the pods? If there are multiple zookeeper and Kafka pods, a single window would certainly be a boon for administrators and management.
Grafana provides Loki and Promtail a functionality to aggregate logs and view them from the same Grafana UI.
I have tested this in Fedora 33, minikube version: v1.15.1.
Prerequisites Needed
- helm: Download Linux amd64 distribution. Also, set it in the system path. I have downloaded the latest one. At the time of writing this article, the latest version is Helm 3.5.2.
- Grafana Helm charts
Step 1
Install Loki and Promtail via helm-charts. To do this, we have to add the helm repository with these charts. Finally, we will find the Loki and Promtail pods that are created. Also, a daemonset promtail is created. We also see service/loki listening on port 3100.
$ kubectl create ns loki-promtail
$ kubectl config set-context --current --namespace=loki-promtail
$ helm repo add grafana https://grafana.github.io/helm-charts
$ helm repo update
$ helm install loki grafana/loki
$ helm install promtail grafana/promtail
$ kubectl get all
NAME READY STATUS RESTARTS AGE
pod/loki-0 1/1 Running 2 108m
pod/promtail-ffw58 1/1 Running 1 79m
NAME TYPE CLUSTER-IP EXTERNAL-IP PORT(S) AGE
service/loki ClusterIP 10.103.195.122 <none> 3100/TCP 108m
service/loki-headless ClusterIP None <none> 3100/TCP 108m
NAME DESIRED CURRENT READY UP-TO-DATE AVAILABLE NODE SELECTOR AGE
daemonset.apps/promtail 1 1 1 1 1 <none> 107m
NAME READY AGE
statefulset.apps/loki 1/1 108m
[chandrashekhar@localhost ~]$
Step 2
Check the logs of the Promtail pod and check that it is connected to the Loki pod with service/loki on port 3100.
x
$ kubectl logs -f promtail-ffw58
level=warn ts=2021-02-08T16:56:07.119631932Z caller=client.go:288 component=client host=loki-gateway msg="error sending batch, will retry" status=-1 error="Post \"http://loki-gateway/loki/api/v1/push\": dial tcp: lookup loki-gateway on 10.96.0.10:53: no such host"
level=warn ts=2021-02-08T16:56:11.368207816Z caller=client.go:288 component=client host=loki-gateway msg="error sending batch, will retry" status=-1 error="Post \"http://loki-gateway/loki/api/v1/push\": dial tcp: lookup loki-gateway on 10.96.0.10:53: server misbehaving"
Here we find that Promtail is trying to connect to loki-gateway. But it should connect to service Loki on port 3100.
Step 3
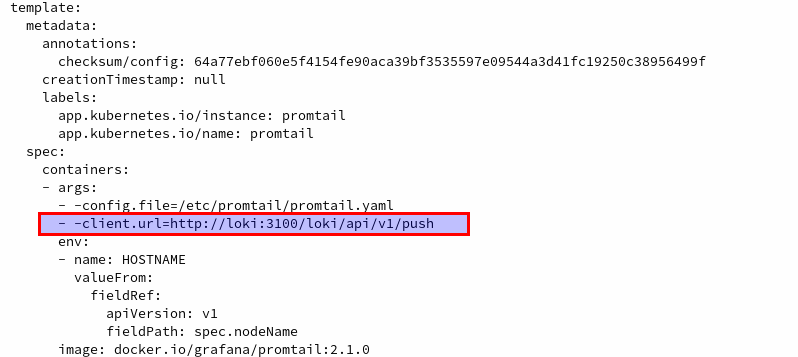
To configure the correct url so that the Promtail agent connects to Loki correctly, we will edit the daemonset. We will have to add the argument -client.url=http://loki:3100/loki/api/v1/push.
xxxxxxxxxx
$ kubectl edit daemonset promtail
# Check screen-shot "DaemonsetPromtail". Once we edit we will find that new promtail pod is created while previous one get terminated.
$ kubectl get pods
NAME READY STATUS RESTARTS AGE
loki-0 1/1 Running 2 131m
promtail-mt2fn 1/1 Running 0 3m59s
Step 4
Let us connect Grafana with Loki. I have downloaded Grafana from the Grafana Download Page. But before that, we have to port-forward the Loki port.
xxxxxxxxxx
[chandrashekhar@localhost ~]$ kubectl port-forward pod/loki-0 3100:3100
Forwarding from 127.0.0.1:3100 -> 3100
Forwarding from [::1]:3100 -> 3100
Handling connection for 3100
Handling connection for 3100
Step 5
Before we go to Grafana configurations, I want to highlight a few important concepts here:
- If we check the details of the daemonset promtail, we will find that a path of nodes are mounted. An interesting one is
/var/log/podswhich has all pods logged of that node. Promtail keeps seeking these logs and sends these to the Loki instance.
x
$ kubectl describe daemonset promtail
---
---
Volumes:
config:
Type: Secret (a volume populated by a Secret)
SecretName: promtail
Optional: false
run:
Type: HostPath (bare host directory volume)
Path: /run/promtail
HostPathType:
containers:
Type: HostPath (bare host directory volume)
Path: /var/lib/docker/containers
HostPathType:
pods:
Type: HostPath (bare host directory volume)
Path: /var/log/pods
HostPathType:
$ minikube ssh -p grafana-loki-promtail
_ _
_ _ ( ) ( )
___ ___ (_) ___ (_)| |/') _ _ | |_ __
/' _ ` _ `\| |/' _ `\| || , < ( ) ( )| '_`\ /'__`\
| ( ) ( ) || || ( ) || || |\`\ | (_) || |_) )( ___/
(_) (_) (_)(_)(_) (_)(_)(_) (_)`\___/'(_,__/'`\____)
$ cd /var/log/pods
$ ls -ltr
total 68
drwxr-xr-x 3 root root 4096 Feb 8 14:25 kube-system_kube-controller-manager-grafana-loki-promtail_6cb144f7d82285562d6fc7ed0aeee754
drwxr-xr-x 3 root root 4096 Feb 8 14:25 kube-system_etcd-grafana-loki-promtail_88825ba870a02c365fe16e52439a90a4
drwxr-xr-x 3 root root 4096 Feb 8 14:25 kube-system_kube-scheduler-grafana-loki-promtail_38744c90661b22e9ae232b0452c54538
drwxr-xr-x 3 root root 4096 Feb 8 14:25 kube-system_kube-apiserver-grafana-loki-promtail_48f4e85267da14088611f2bc4ef06346
drwxr-xr-x 3 root root 4096 Feb 8 14:27 kube-system_storage-provisioner_06b572e5-fce0-488e-b59a-caabf7225ff6
drwxr-xr-x 3 root root 4096 Feb 8 14:27 kube-system_kube-proxy-b9j9l_c9f10bef-dc08-4761-847d-e147464f9a47
drwxr-xr-x 3 root root 4096 Feb 8 14:27 kube-system_coredns-f9fd979d6-h8zdd_049462d0-4b7e-44fe-9586-478ae2545f03
drwxr-xr-x 3 root root 4096 Feb 8 14:40 kafka_strimzi-cluster-operator-68c6747bc6-55wzp_d49274d8-0426-4051-a41a-1898b833f131
drwxr-xr-x 3 root root 4096 Feb 8 14:43 kafka_my-cluster-zookeeper-0_4832c0f4-497f-4cd9-bf98-8a854b76719b
drwxr-xr-x 3 root root 4096 Feb 8 14:43 kafka_my-cluster-zookeeper-1_9d9dd946-67a1-44e7-aefa-d396e898f4b4
drwxr-xr-x 3 root root 4096 Feb 8 14:43 kafka_my-cluster-zookeeper-2_283303f6-4e9d-4f9f-8256-db5a7894e315
drwxr-xr-x 3 root root 4096 Feb 8 14:45 kafka_my-cluster-kafka-2_392d9e35-33af-492b-a14e-63551af23d28
drwxr-xr-x 3 root root 4096 Feb 8 14:45 kafka_my-cluster-kafka-0_662e1456-28e9-4096-9a11-69fab28ccf4b
drwxr-xr-x 3 root root 4096 Feb 8 14:45 kafka_my-cluster-kafka-1_136a12f5-a5a1-452c-9888-8f779a767d99
drwxr-xr-x 5 root root 4096 Feb 8 14:46 kafka_my-cluster-entity-operator-5fd974964d-xhrct_fc9bbff5-a943-4a34-88a6-630f063252aa
drwxr-xr-x 3 root root 4096 Feb 8 17:38 loki-promtail_loki-0_6db579ab-9f17-4008-bf5b-b0bb1cc53d6f
drwxr-xr-x 3 root root 4096 Feb 8 17:40 loki-promtail_promtail-bzp78_1d608779-c719-4525-bb79-0e479b718f54
$
- In a production environment, you might need Promtail pods only in a worker node, but not in infra nodes or a master node. This can be achieved with nodeAffinity:
xxxxxxxxxx
spec:
affinity:
nodeAffinity:
requiredDuringSchedulingIgnoredDuringExecution:
nodeSelectorTerms:
- matchExpressions:
- key: node-role.kubernetes.io/infra
operator: DoesNotExist
- If we want a more customized Promtail agent setup, then we might need to modify the promtail.yaml configuration which is mounted as secret. The secret's content is base64 encoded which can easily be decoded. Once decoded, we can get the configurations and customize them further. We can even use the following commands:
x
$ kubectl get daemonset promtail -o yaml
containers:
- args:
- -config.file=/etc/promtail/promtail.yaml
- -client.url=http://loki:3100/loki/api/v1/push
---
volumeMounts:
- mountPath: /etc/promtail
name: config
---
volumes:
- name: config
secret:
defaultMode: 420
secretName: promtail
$ kubectl get secret promtail -o yaml
apiVersion: v1
data:
promtail.yaml: c2VydmVyOgogIGxvZ19sZXZlbDogaW5mbwogIGh0dHBfbGlzdGVuX3BvcnQ6IDMxMDEKCmNsaWVudDoKICB1cmw6IGh0dHA6Ly9sb2tpLWdhdGV3YXkvbG9raS9hcGkvdjEvcHVzaAoKcG9zaXRpb25zOgogIGZpbGVuYW1lOiAvcnVuL3Byb210YWlsL3Bvc2l0aW9ucy55YW1sCgpzY3JhcGVfY29uZmlnczoKICAjIFNlZSBhbHNvIGh0dHBzOi8vZ2l0aHViLmNvbS9ncmFmYW5hL2xva2kvYmxvYi9tYXN0ZXIvcHJvZHVjdGlvbi9rc29ubmV0L3Byb210YWlsL3
---
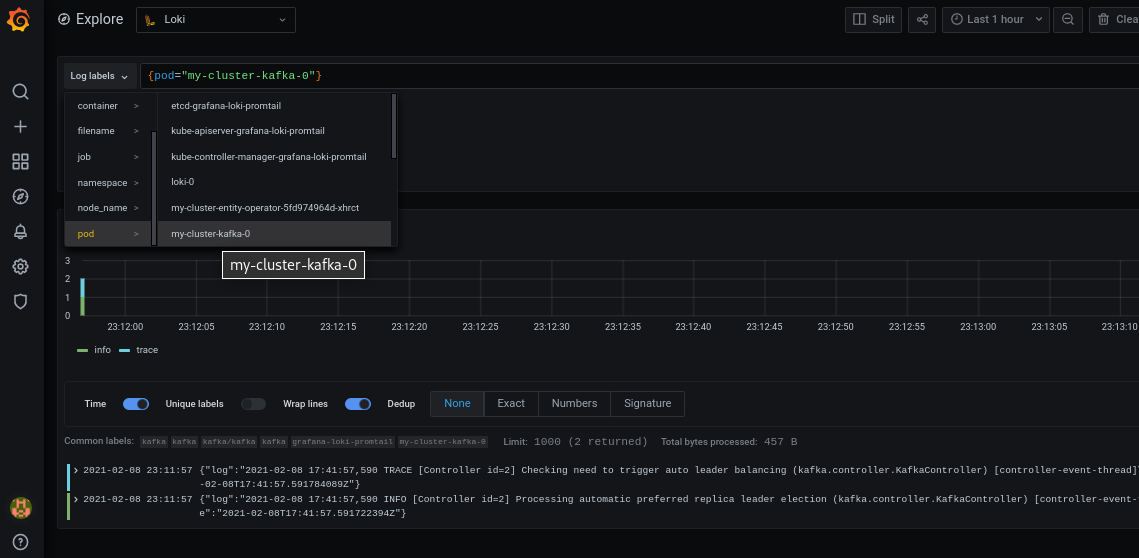
Step 6
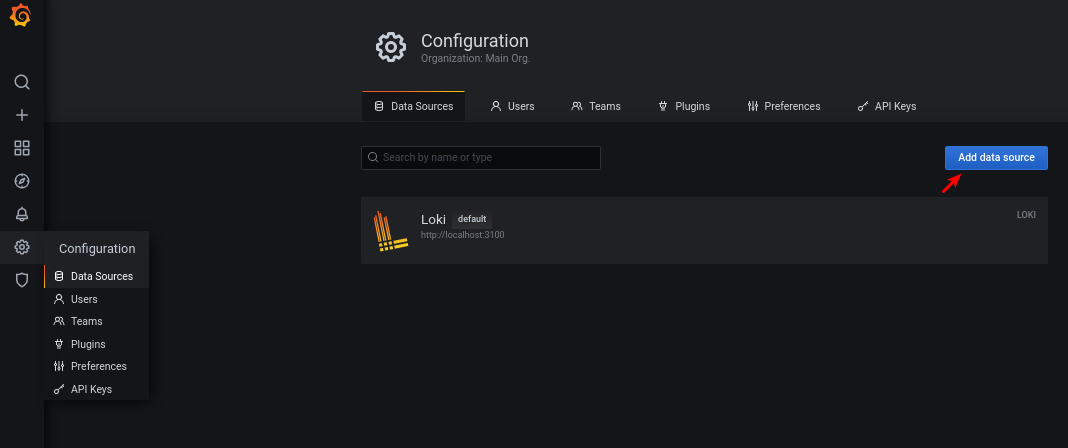
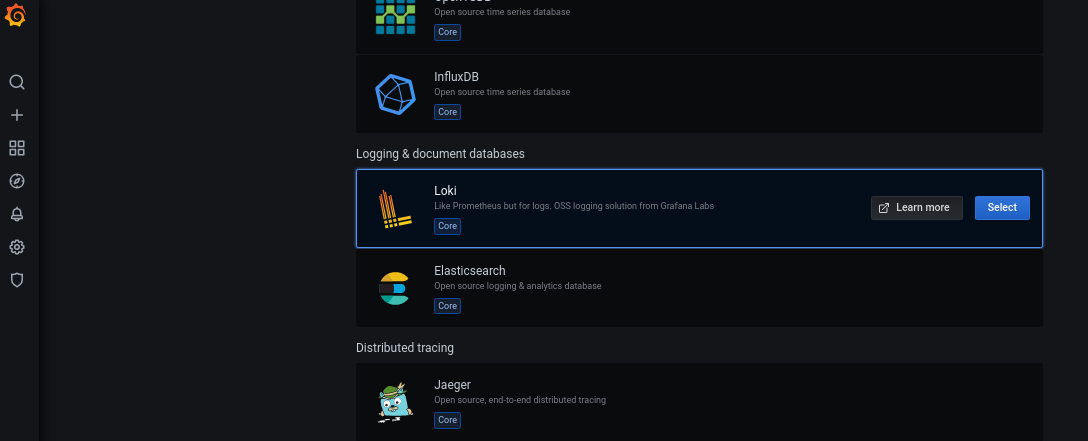
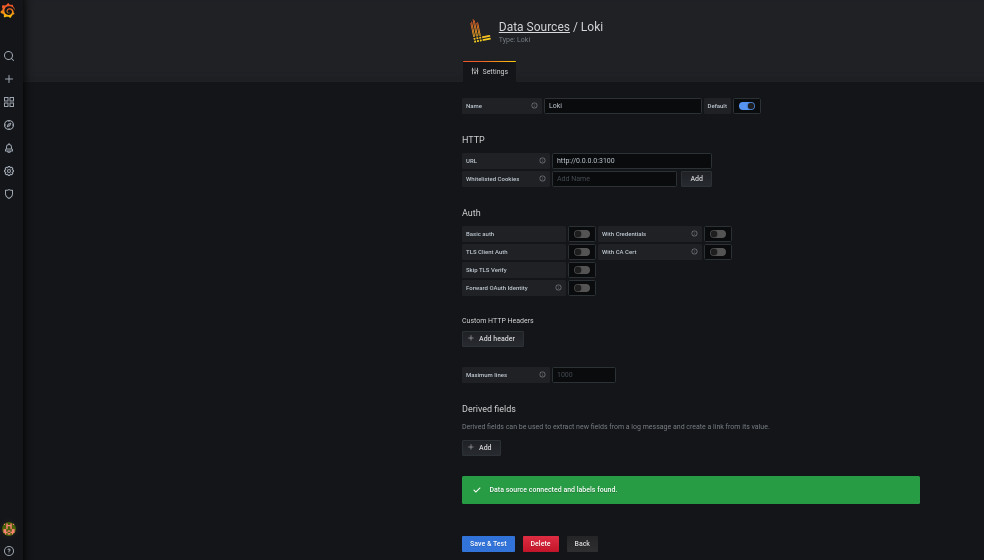
Follow the screenshots to configure Grafana to connect to Loki instances and monitor logs.
That's it, guys. I hope you find this article interesting and informative.
Opinions expressed by DZone contributors are their own.
Comments