Making Dropwizard Metrics Accessible via CQL in Apache Cassandra
The journey into Apache Cassandra's metrics system, specifically through the lens of Dropwizard Metrics and the virtual table API.
Join the DZone community and get the full member experience.
Join For FreeMetrics are a vital part of complex distributed storage systems, such as Apache Cassandra. It's important for an operator and a user to have access to metrics at the OS, JVM, and application levels to have full control over the data that is being processed and to prevent emergencies before they occur.
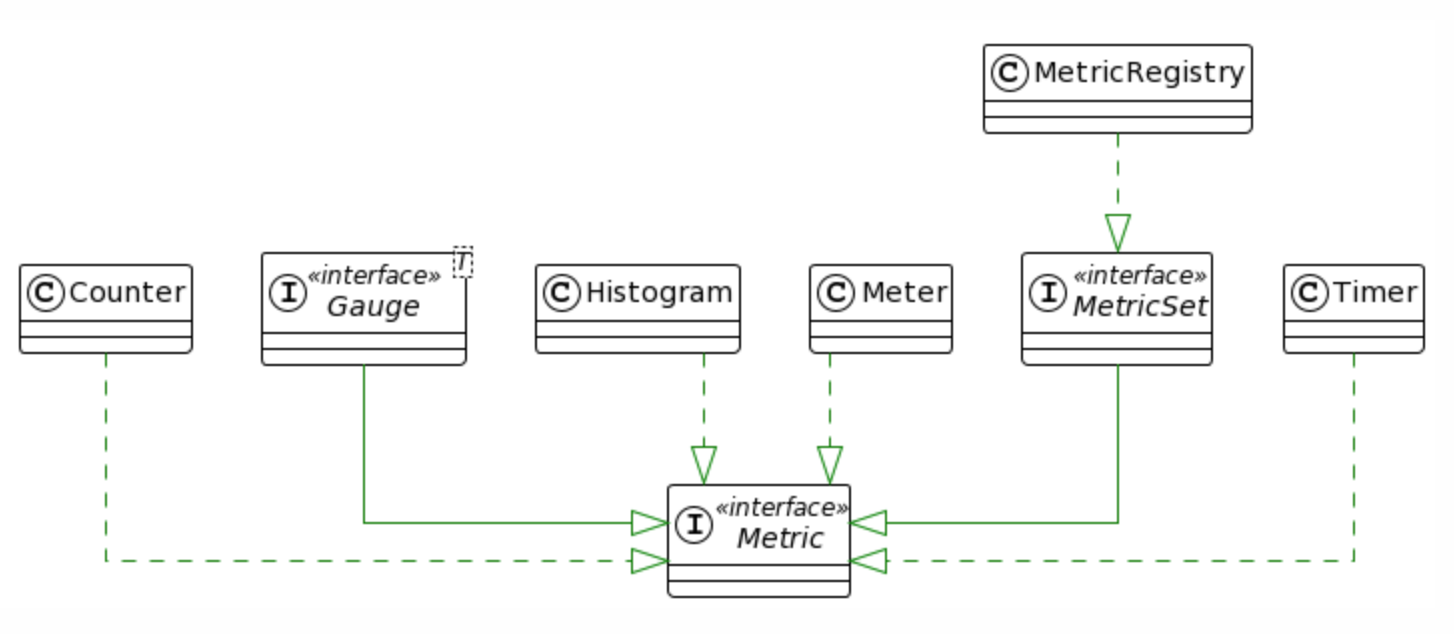
To make metrics accessible, Cassandra heavily relies on the open-source Dropwizard Metrics library, which acts as a skeleton for both metrics representation and storage. Metrics representations are provided as Histogram, Timer, Meter, Gauge, etc. classes for metric types, while storage uses MetricRegistry. The Dropwizard library makes it easy to expose the database internals through various APIs, like JMX or REST, in addition to the sidecar pattern. Apache Casandra has a vibrant ecosystem in this regard, for example, you can write your java-agent to export all data from the registry to the collectd Unix daemon. In conjunction, Cassandra's virtual tables, which are a relatively recent development by the project's standards (available since 4.0), have only a fraction of all the metrics so far, so don't give a full view of internal processes and need to be improved to rectify this.
My name is Maxim Muzafarov, I'm an Apache Ignite PMC member, an Apache Cassandra Committer and a software engineer in the Open Source Program Office at Aiven, a global open-source data platform company. I'd like to tell you about the problems that I encountered while implementing a new patch to “Expose all table metrics in the virtual table” and the challenges and issues that have been addressed to finally make all metrics available through virtual tables so that users can rely on them and query them performantly.
Overview Metrics Architecture
Some of the issues we will observe flow seamlessly from how Dropwizard Metrics is used in the source code and the limitations of the library itself, so a word or two about the library's architecture is worthwhile.
The starting point for Dropwizard Metrics is the MetricRegistry, which is a set of all the metrics registered in Apache Cassandra. This registry uses a ConcurrentHashMap under the hood, with metric names as keys and instances of various metric types as values. Apache Cassandra uses a singleton instance of MetricRegistry, and as a result, we have one global set of metrics for monitoring. Consequently, the way we construct metric names is crucial, as these names are essential for filtering and identifying the correct entities within metric groups during CQL query execution. You will see below how this might affect performance.
However, unlike a popular alternative like Prometheus, Dropwizard Metrics has some limitations. In particular, it lacks label support, which is extremely useful for evolving metric names and deprecating the old ones to preserve backward compatibility (this issue is overcome as a registering alias for a metric via the CassandraMetricsRegistry extension). It also has a tendency to perform calculations on the server side, which, if the monitoring system is incorrectly configured, can affect node performance and increase the overall GC pressure on the node. This is particularly true for Histograms in Apache Cassandra, which by design involve some heavy calculations through the o.a.c.m.DecayingEstimatedHistogramReservoir across buckets of stored counters. Prometheus, on the other hand, exposes raw values.
CQL Metrics Reporter
Apache Cassandra 4.0 introduced virtual tables, which emulate access to system information through the same API used to access and manage data stored as SSTables. This, in turn, means that we can create a virtual table around an internal collection of data stored in the JVM heap (or off-heap) to represent it as a table, and the MetricRegistry is exactly a collection of metrics we intend to export. This is where the concept of the Dropwizard Metrics Reporter comes in, which I’ve implemented.
Requirements and Testing
In practice, either the CQLReporter or a virtual table adapter, designed to export all metrics as virtual tables, should support certain types of queries. These include accessing a specific value by its metric name and querying a range of metric values, essentially implementing pagination in queries.
These requirements allow us to create test query patterns based on our needs. We can use these tests to regularly check our implementation and identify any performance issues that we may have overlooked. The key is to generate a large enough set of metrics to quickly uncover any potential problems. To facilitate this, I've set up a single-node cluster with 1000 keyspaces, each containing one table, and used the Latte Benchmarking Tool to run and compare the benchmark results.
Through the process of writing code for the virtual table adapter and benchmarking each intermediate stage of implementation, I've identified critical flaws that lead to poor performance and a large GC footprint. So, I’m eager to share these findings with you now.
Finding #1: Keep in Mind Object's Lifecycles
This is the simplest rule of thumb, but it is still important to keep it in mind at all times. In Java, garbage collection happens automatically during the lifetime of a program, so there is no need to deallocate memory manually. At the same time, failing to release objects that are no longer necessary can lead to memory leaks. When you're working with an internal component and you see start/stop or add/remove, which identifies the component's lifecycle, always remember that you need to clean up the resources that you've used.
For example, when a user wants to create a keyspace, a set of unique metrics, such as the number of pending compactions and so on, is created accordingly. This set of metrics only makes sense during the lifetime of the keyspace and must be released when the keyspace is dropped. Otherwise, the set of metrics will grow, causing memory leakage and performance degradation.
Finding #2: Unnecessary Allocations
Initially, assuming that virtual tables with metrics would be used quite intensively, I wanted to see what the value of the memory footprint would be. To get a feel for this, I used the Cassandra Stress and previously mentioned the Latte Benchmark Tool to stress my single-node cluster and took some flight recordings using Java Mission Control (JMC); using the "object allocation and promotion" profiling setting was enough to find major flaws in the implementation.
The following fairly obvious flaws quickly became apparent:
- Unnecessary auxiliary objects on requests: Each time a new subset of metrics was requested, e.g., by calling the
getCounters()method, a new instance of a TreeMap was created. This is part of the MetricsRegistry implementation, which is not well suited to being in the hotpath in our case. A new map for each query is a very expensive way to fetch the metrics, and it is better to avoid it; - Unnecessary conversions and buffer allocations: On the one hand, we have metric names and metric instances stored as strings or objects on the JVM heap, and on the other hand, we have a piece of the same data represented in binary format for further comparison (as a DecoratedKey and/or DataRange by the rule of the virtual table API we use). It turns out that not creating and, in turn, not allocating ByteBuffers, a DecoratedKey for each metric for the sake of filtering results and producing the output gives us performance benefits, a rather obvious observation but still worth mentioning.
As a result, by eliminating these flaws, I was able to increase throughput by almost ~ +10% over the previous version.
Finding #3: Lazy Computation of Values
Another relatively simple and easy-to-implement technique that reduces the memory required for computations and reduces the GC pressure, thereby enhancing overall efficiency, gave us ~140% of the overall throughput increase.
It's important to delay the calculation of expensive metric values until it's absolutely necessary. This approach is both simple and practical to implement. Initially, use the minimum necessary parameters, such as the metric type and/or name, to filter out as much data as possible. Compute the metric value only after this initial filtering step, specifically to construct a table row for the output result.
This method is applicable to metric types such as com.codahale.metrics.Histogram and com.codahale.metrics.Timer. These types are being offered as several different Reservoirs classes for processing their stored measurements. For example, configuring a metric with com.codahale.metrics.SlidingTimeWindowReservoir involves a sliding window mechanism that only keeps measurements from the last N seconds.
It is also clearly visible in Java Mission Control when profiling:
Stack Trace    Count    Percentage
void o.a.c.m.DecayingEstimatedHistogramReservoir$AbstractSnapshot.<init>(DecayingEstimatedHistogramReservoir)    15323    8,79 %
void o.a.c.m.DecayingEstimatedHistogramReservoir$EstimatedHistogramReservoirSnapshot.<init>(DecayingEstimatedHistogramReservoir)    14036    8,05 %
Snapshot o.a.c.m.DecayingEstimatedHistogramReservoir.getSnapshot()    14036    8,05 %
Snapshot com.codahale.metrics.Histogram.getSnapshot()    14036    8,05 %
String o.a.c.m.CassandraMetricsRegistry.getValueAsString(Metric)    14036    8,05 %
String org.apache.cassandra.db.virtual.model.MetricRow.value()    14036    8,05 %
void org.apache.cassandra.db.virtual.model.MetricRowWalker.visitRow(MetricRow, RowWalker$RowMetadataVisitor)    14036    8,05 %
Finding #4: Enhancing Search Efficiency
Once all the teething problems and bottlenecks have been overcome, we can start thinking about the metrics set itself to improve the query execution time and overall throughput.
Metrics in the application are tied to some internal component that needs to be monitored. This connection is key to efficient search, and so our strategies for organizing metrics might be:
- Division of metrics: We can categorize the entire set of metrics into different MetricRegisters. Each MetricRegister corresponds to a specific metric group and, in turn, reduces the iteration costs;
- Incorporating group name: We can include the metric group name directly within the metric's name. This strategy enhances the efficiency of metric filtering and the use of
hashCode()on the metric name, each time we need to identify the metric group becomes redundant;
Although the latter gives us a pretty good performance improvement, we can actually use both.
Finding #5: Parallel Processing Isn't Faster
Apache Cassandra can host a large number of tables and keyspaces, resulting in a large number of corresponding metrics. Effectively responding to user queries in this context requires filtering this large set of metrics. An important consideration here is the choice between sequential and parallel processing, which the Java Stream API provides:
// true - parallel processing, false - sequential processing
StreamSupport.stream(data.spliterator(), true)
.map(metric -> makeRow(metric, columnFilter))
.filter(row -> keyRange.contains(row.key()))
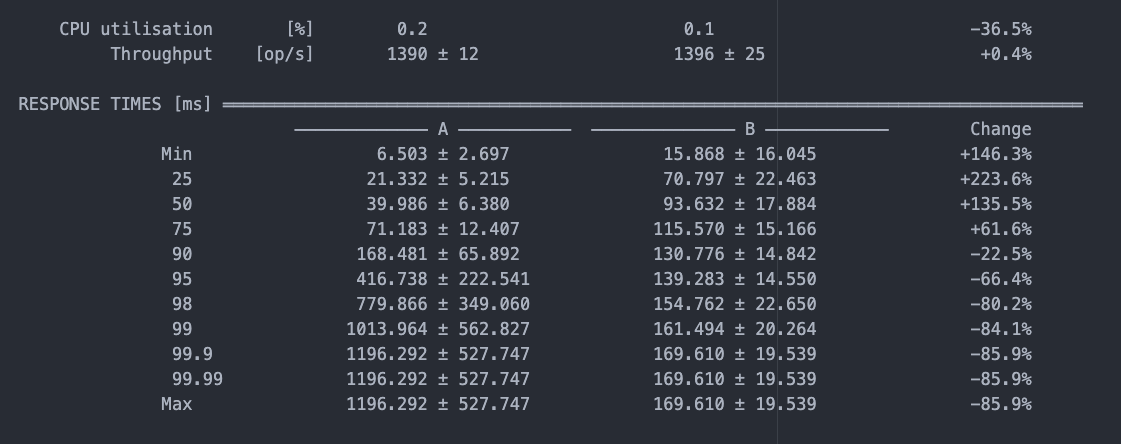
.forEach(row -> map.put(row.getKey(), row));Consider the benchmark example below, which compares parallel (A) and sequential (B) processing of metrics. The results show similar throughput for both methods. However, while parallel processing yields faster first results, sequential processing provides more stability and puts less pressure on GC.
Consequently, sequential processing is more suitable for querying a virtual table by metric name to retrieve a single metric value. This approach is well suited to the requirements of external monitoring systems. On the other hand, parallel processing is more suitable for range queries initiated by users.
Finding #6: Solidify Design Model
The MetricRegistry stores metrics in a map, with each metric's unique identifier acting as the map key. It's important to keep in mind that all these metrics are local to the node being monitored. Meanwhile, the Virtual Table API provides a large variety of ways to create virtual table metadata, allowing you to construct a primary key composed of one or more partition keys and zero or more clustering keys.
However, for the purpose of exposing metrics, this approach might be more complex than necessary. If we simplify the structure by assuming that the primary key and partition key are identical and that the metrics virtual table does not have clustering keys, we can significantly improve the process of retrieving metric values by name. This technique is much faster using a map when we need to query by key than iterating through the Collection interface, which is the general approach to exposing the internal data as virtual tables.
Demo
As a result of all these improvements, the internal metrics stored in the MetricRegistry are available under a new virtual system_metrics keyspace, allowing you to query them in a high-performance manner.
The snippet below shows the most common usage example:
Conclusion
In summary, this journey into Apache Cassandra's metrics system, specifically through the lens of Dropwizard Metrics and the virtual table API, reveals several insights and strategies for optimizing performance and efficiency for a particular implementation, such as lazy computation of metric values, improving search efficiency and filtering of a large metric set, and provides benchmark results comparing sequential vs. parallel processing of the metric set for the needs of a CQL query.
Opinions expressed by DZone contributors are their own.
Comments