Playing With Pandas DataFrames (With Missing Values Table Example)
Sometimes, you may want to concat two dataframes by column base or row base. For this action, you can use the concat function.
Join the DZone community and get the full member experience.
Join For FreeSometimes, you may want to concat two dataframes by column base or row base. For this action, you can use the concat function. These can be done by the following code.
xxxxxxxxxx
#row base concatenation
pd.concat([df1, df2])
#column base concatentation
pd.concat([df1, df2], axis=1)
For a column base, you have to give axis=1 parameter. I want to explain this functionality by preparing a simple missing values table.
You may also like: PySpark DataFrame Tutorial: Introduction to DataFrames
For this, I will again use the data set I have referred to in my article Pandas Dataframe Functions. First, we have to load the data.
xxxxxxxxxx
import pandas as pd
import numpy as np
#load data
df = pd.read_csv("train.csv")
After loading the data we will calculate some information about the data frame and concat them in a dataframe at the end.
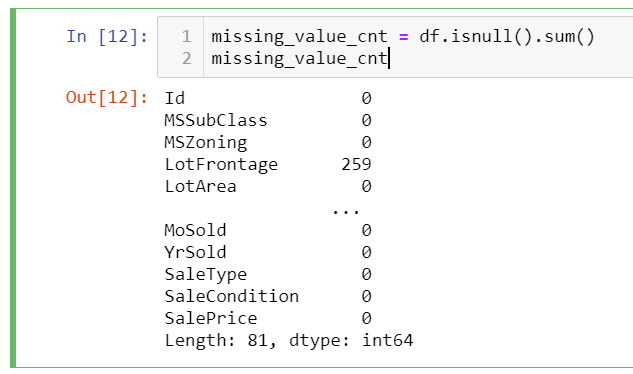
First, we can calculate the null count of each column by the following code and assign it to a variable.
xxxxxxxxxx
missing_value_cnt = df.isnull().sum()
missing_value_cnt
It will give the following result. This will be our first column:
xxxxxxxxxx
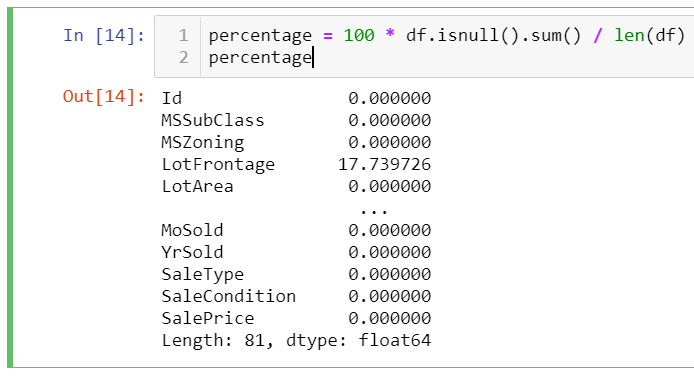
percentage = 100 * df.isnull().sum() / len(df)
percentage
This calculation will give the percentage of the null values in the total values of the column.

Lastly, data types can be also added to our missing value table:
xxxxxxxxxx
data_types = df.dtypes
data_types
Three of the data sets give us one-dimensional series data. We will concat them to create our final dataframe:
xxxxxxxxxx
missing_values_table = pd.concat([missing_value_cnt, percentage, data_types], axis=1)
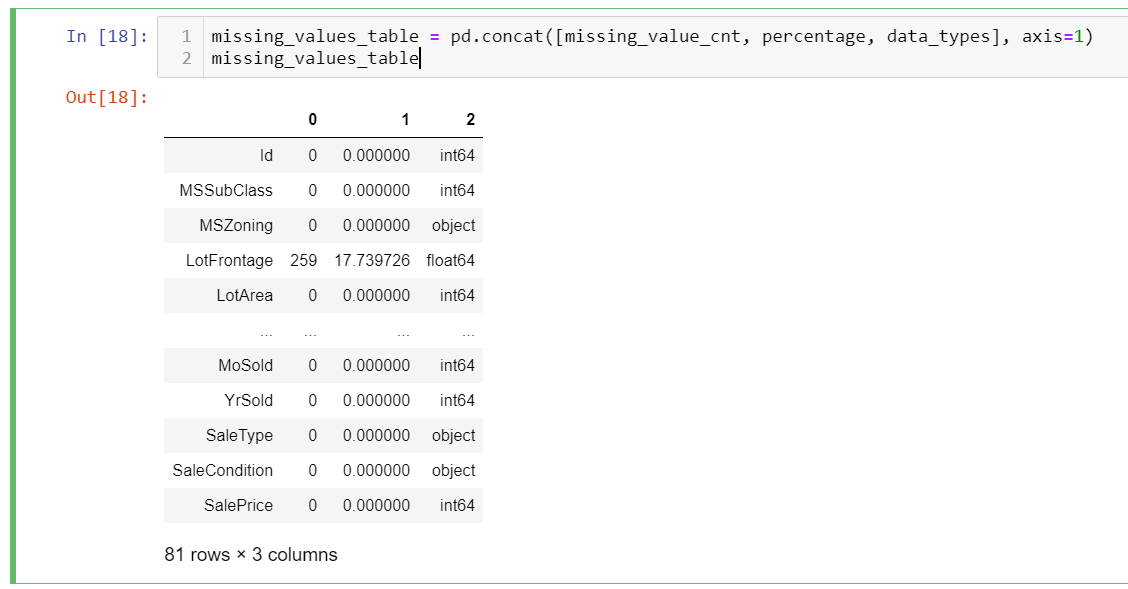
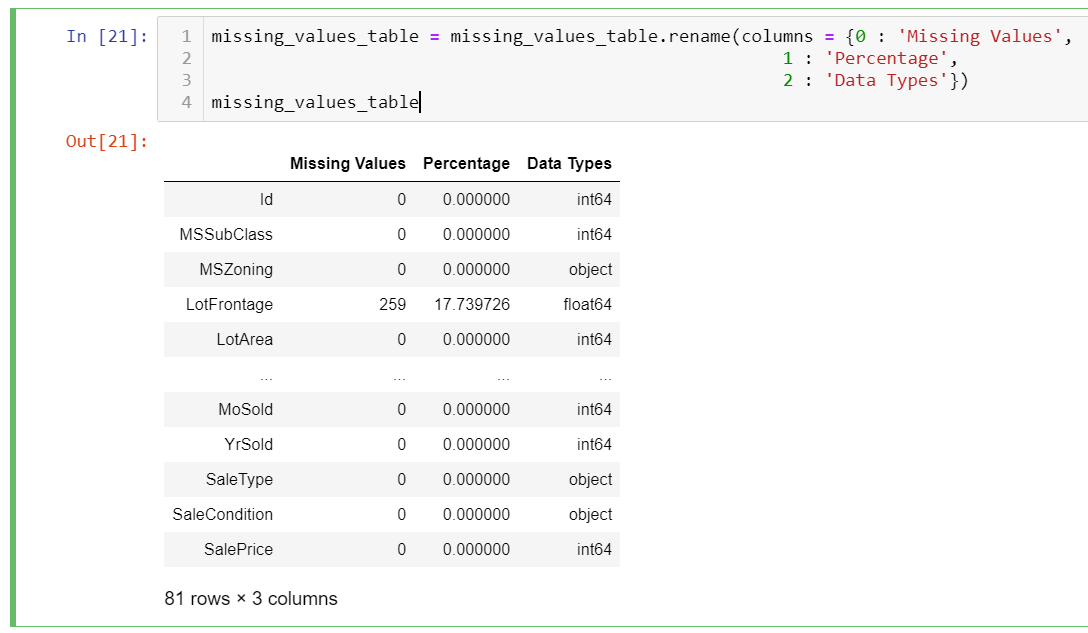
As you can see it has all the values, since we want only missing values, we have to filter the result set. Moreover, there are no column names, to clarify what type of data the column has, we also have to rename all the columns. These can be done by the following codes.
xxxxxxxxxx
missing_values_table = mis_val_table.rename(columns = {0 : 'Missing Values',
1 : 'Percentage',
2 : 'Data Types'})
And now it is time to filter the data frame just to list the missing values statistics for the loaded data frame. For filtering dataframe, iloc and loc can be used.
Selecting Rows and Columns By Loc and ILoc
Data can be selected from data frames by using loc and iloc options:
Loc is used for selecting rows and columns by index and value label, columns can be selected by column names,
Iloc is used for selecting rows and columns by their indexes.
Here are some examples before continuing our missing tables example.
xxxxxxxxxx
#let's call the sample dataframe as df:
df.iloc[0] # it gets the first row of the df
df.iloc[:0] # it gets the first column of the df
df.iloc[0:3] # first three rows of the df.
df.iloc[,0:2] # first two columns of the df with all rows
Examples by loc: one of the ways is querying data by loc is using indexes on dataframe
xxxxxxxxxx
df.set_index('first_name', inplace=True) # assume the df has first_name column
df.loc(['zehra'])
The above query gives the data from df where the first_name column has the "zehra" values. or you can query by conditional expressions.
xxxxxxxxxx
df.loc[df['first_name'] == 'zehra', 0:2]
Gets all the rows for the "zehra" value with the first two columns in df.
Here is our final missing values table for our dataframe.
xxxxxxxxxx
missing_values_table = missing_values_table[
missing_values_table.iloc[:,1] != 0].sort_values(
'Percentage', ascending=False).round(1)
missing_values_table
The above code first filters the data based on the Percentage column and then sort by on this column in descending order. The "missing value table" gives you a simple readable table for your data frame missing values.
Further Reading
Opinions expressed by DZone contributors are their own.
Comments