Harnessing the Power of Observability in Kubernetes With OpenTelemetry
This article provides a thorough guide on implementing OpenTelemetry in a Kubernetes environment, showcasing how to enhance observability.
Join the DZone community and get the full member experience.
Join For FreeIn today's dynamic and complex cloud environments, observability has become a cornerstone for maintaining the reliability, performance, and security of applications. Kubernetes, the de facto standard for container orchestration, hosts a plethora of applications, making the need for an efficient and scalable observability framework paramount. This article delves into how OpenTelemetry, an open-source observability framework, can be seamlessly integrated into a Kubernetes (K8s) cluster managed by KIND (Kubernetes IN Docker), and how tools like Loki, Tempo, and the kube-prometheus-stack can enhance your observability strategy. We'll explore this setup through the lens of a practical example, utilizing custom values from a specific GitHub repository.
The Observability Landscape in Kubernetes
Before diving into the integration, let's understand the components at play:
- KIND offers a straightforward way to run K8s clusters within Docker containers, ideal for development and testing.
- Loki is a horizontally scalable, highly available, multi-tenant log aggregation system inspired by Prometheus.
- Tempo is a high-volume, minimal-dependency trace aggregator, providing a robust way to store and query distributed traces.
- kube-prometheus-stack bundles Prometheus together with Grafana and other tools to provide a comprehensive monitoring solution out-of-the-box.
- OpenTelemetry Operator simplifies the deployment and management of OpenTelemetry collectors in K8s environments.
- Promtail is responsible for gathering logs and sending them to Loki.
Integrating these components within a K8s cluster orchestrated by KIND not only streamlines the observability but also leverages the strengths of each tool, creating a cohesive and powerful monitoring solution.
Setting up Your Kubernetes Cluster With KIND
Firstly, ensure you have KIND installed on your machine. If not, you can easily install it using the following command:
curl -Lo ./kind https://kind.sigs.k8s.io/dl/v0.11.1/kind-$(uname)-amd64
chmod +x ./kind
mv ./kind /usr/local/bin/kind
Once KIND is installed, you can create a cluster by running:
kind create cluster --config kind-config.yaml
kubectl create ns observability
kubectl config set-context --current --namespace observability
kind-config.yaml should be tailored to your specific requirements. It's important to ensure your cluster has the necessary resources (CPU, memory) to support the observability tools you plan to deploy.
Deploying Observability Tools With HELM
HELM, the package manager for Kubernetes, simplifies the deployment of applications. Here's how you can install Loki, Tempo, and the kube-prometheus-stack using HELM:
- Add the necessary HELM repositories:
helm repo add grafana https://grafana.github.io/helm-charts
helm repo add prometheus-community https://prometheus-community.github.io/helm-charts
helm repo update
- Install Loki, Tempo, and kube-prometheus-stack:
For each tool, we'll use a custom values file available in the provided GitHub repository. This ensures a tailored setup aligned with specific monitoring and tracing needs.
- Loki:
helm upgrade --install loki grafana/loki --values https://raw.githubusercontent.com/brainupgrade-in/kubernetes/main/observability/opentelemetry/01-loki-values.yaml
- Tempo:
helm install tempo grafana/tempo --values https://raw.githubusercontent.com/brainupgrade-in/kubernetes/main/observability/opentelemetry/02-tempo-values.yaml
- kube-prometheus-stack:
helm install kube-prometheus-stack prometheus-community/kube-prometheus-stack --values https://raw.githubusercontent.com/brainupgrade-in/kubernetes/main/observability/opentelemetry/03-grafana-helm-values.yaml
- Install OpenTelemetry Operator and Promtail:
The OpenTelemetry Operator and Promtail can also be installed via HELM, further streamlining the setup process.
- OpenTelemetry Operator:
helm install opentelemetry-operator open-telemetry/opentelemetry-operator
- Promtail:
helm install promtail grafana/promtail --set "loki.serviceName=loki.observability.svc.cluster.local"
Configuring OpenTelemetry for Optimal Observability
Once the OpenTelemetry Operator is installed, you'll need to configure it to collect metrics, logs, and traces from your applications. OpenTelemetry provides a unified way to send observability data to various backends like Loki for logs, Prometheus for metrics, and Tempo for traces.
A sample OpenTelemetry Collector configuration might look like this:
apiVersion: opentelemetry.io/v1alpha1
kind: OpenTelemetryCollector
metadata:
  name: otel
  namespace: observability
spec:
  config: |
    receivers:
      filelog:
        include: ["/var/log/containers/*.log"]
      otlp:
        protocols:
          grpc:
            endpoint: 0.0.0.0:4317
          http:
            endpoint: 0.0.0.0:4318
    processors:
      memory_limiter:
        check_interval: 1s
        limit_percentage: 75
        spike_limit_percentage: 15
      batch:
        send_batch_size: 1000
        timeout: 10s

    exporters:
      # NOTE: Prior to v0.86.0 use `logging` instead of `debug`.
      debug:
      prometheusremotewrite:
        endpoint: "http://prometheus-kube-prometheus-prometheus.observability:9090/api/v1/write"
      loki:
        endpoint: "http://loki.observability:3100/loki/api/v1/push"
      otlp:
        endpoint: http://tempo.observability.svc.cluster.local:4317
        retry_on_failure:
          enabled: true
        tls:
          insecure: true
    service:
      pipelines:
        traces:
          receivers: [otlp]
          processors: [memory_limiter, batch]
          exporters: [debug,otlp]
        metrics:
          receivers: [otlp]
          processors: [memory_limiter, batch]
          exporters: [debug,prometheusremotewrite]
        logs:
          receivers: [otlp]
          processors: [memory_limiter, batch]
          exporters: [debug,loki]
  mode: daemonset
This configuration sets up the collector to receive data via the OTLP protocol, process it in batches, and export it to the appropriate backends.
To enable auto-instrumentation for java apps, you can define the following.
apiVersion: opentelemetry.io/v1alpha1
kind: Instrumentation
metadata:
  name: java-instrumentation
  namespace: observability
spec:
  exporter:
    endpoint: http://otel-collector.observability:4317
  propagators:
    - tracecontext
    - baggage
  sampler:
    type: always_on
    argument: "1"
  java:
    env:
      - name: OTEL_EXPORTER_OTLP_ENDPOINT
        value: http://otel-collector.observability:4317
Leveraging Observability Data for Insights
With the observability tools in place, you can now leverage the collected data to gain actionable insights into your application's performance, reliability, and security. Grafana can be used to visualize metrics and logs, while Tempo allows you to trace distributed transactions across microservices.
Visualizing Data With Grafana
Grafana offers a powerful platform for creating dashboards that visualize the metrics and logs collected by Prometheus and Loki, respectively. You can create custom dashboards or import existing ones tailored to Kubernetes monitoring.
Tracing With Tempo
Tempo, integrated with OpenTelemetry, provides a detailed view of traces across microservices, helping you pinpoint the root cause of issues and optimize performance.
Illustrating Observability With a Weather Application Example
To bring the concepts of observability to life, let's walk through a practical example using a simple weather application deployed in our Kubernetes cluster. This application, structured around microservices, showcases how OpenTelemetry can be utilized to gather crucial metrics, logs, and traces. The configuration for this demonstration is based on a sample Kubernetes deployment found here.
Deploying the Weather Application
Our weather application is a microservice that fetches weather data. It's a perfect candidate to illustrate how OpenTelemetry captures and forwards telemetry data to our observability stack. Here's a partial snippet of the deployment configuration. Full YAML is found here.
apiVersion: apps/v1
kind: Deployment
metadata:
  labels:
    app: weather
    tier: front
  name: weather-front
spec:
  replicas: 1
  selector:
    matchLabels:
      app: weather
      tier: front
  template:
    metadata:
      labels:
        app: weather
        tier: front
        app.kubernetes.io/name: weather-front
      annotations:
        prometheus.io/scrape: "true"
        prometheus.io/port: "8888"
        prometheus.io/path: /actuator/prometheus
        instrumentation.opentelemetry.io/inject-java: "true"
        # sidecar.opentelemetry.io/inject: 'true'
        instrumentation.opentelemetry.io/container-names: "weather-front"
    spec:
      containers:
        - image: brainupgrade/weather:metrics
          imagePullPolicy: Always
          name: weather-front
          resources:
            limits:
              cpu: 1000m
              memory: 2048Mi
            requests:
              cpu: 100m
              memory: 1500Mi
          env:
            - name: APP_NAME
              valueFrom:
                fieldRef:
                  apiVersion: v1
                  fieldPath: metadata.labels['app.kubernetes.io/name']
            - name: NAMESPACE
              valueFrom:
                fieldRef:
                  apiVersion: v1
                  fieldPath: metadata.namespace
            - name: OTEL_SERVICE_NAME
              value: $(NAMESPACE)-$(APP_NAME)
            - name: spring.application.name
              value: $(NAMESPACE)-$(APP_NAME)
            - name: spring.datasource.url
              valueFrom:
                configMapKeyRef:
                  name: app-config
                  key: spring.datasource.url
            - name: spring.datasource.username
              valueFrom:
                secretKeyRef:
                  name: app-secret
                  key: spring.datasource.username
            - name: spring.datasource.password
              valueFrom:
                secretKeyRef:
                  name: app-secret
                  key: spring.datasource.password
            - name: weatherServiceURL
              valueFrom:
                configMapKeyRef:
                  name: app-config
                  key: weatherServiceURL
            - name: management.endpoints.web.exposure.include
              value: "*"
            - name: management.server.port
              value: "8888"
            - name: management.metrics.web.server.request.autotime.enabled
              value: "true"
            - name: management.metrics.tags.application
              value: $(NAMESPACE)-$(APP_NAME)
            - name: otel.instrumentation.log4j.capture-logs
              value: "true"
            - name: otel.logs.exporter
              value: "otlp"
          ports:
            - containerPort: 8080
This deployment configures the weather service with OpenTelemetry's OTLP (OpenTelemetry Protocol) exporter, directing telemetry data to our OpenTelemetry Collector. It also labels the service for clear identification within our telemetry data.
Visualizing Observability Data
Once deployed, the weather service starts sending metrics, logs, and traces to our observability tools. Here's how you can leverage this data.
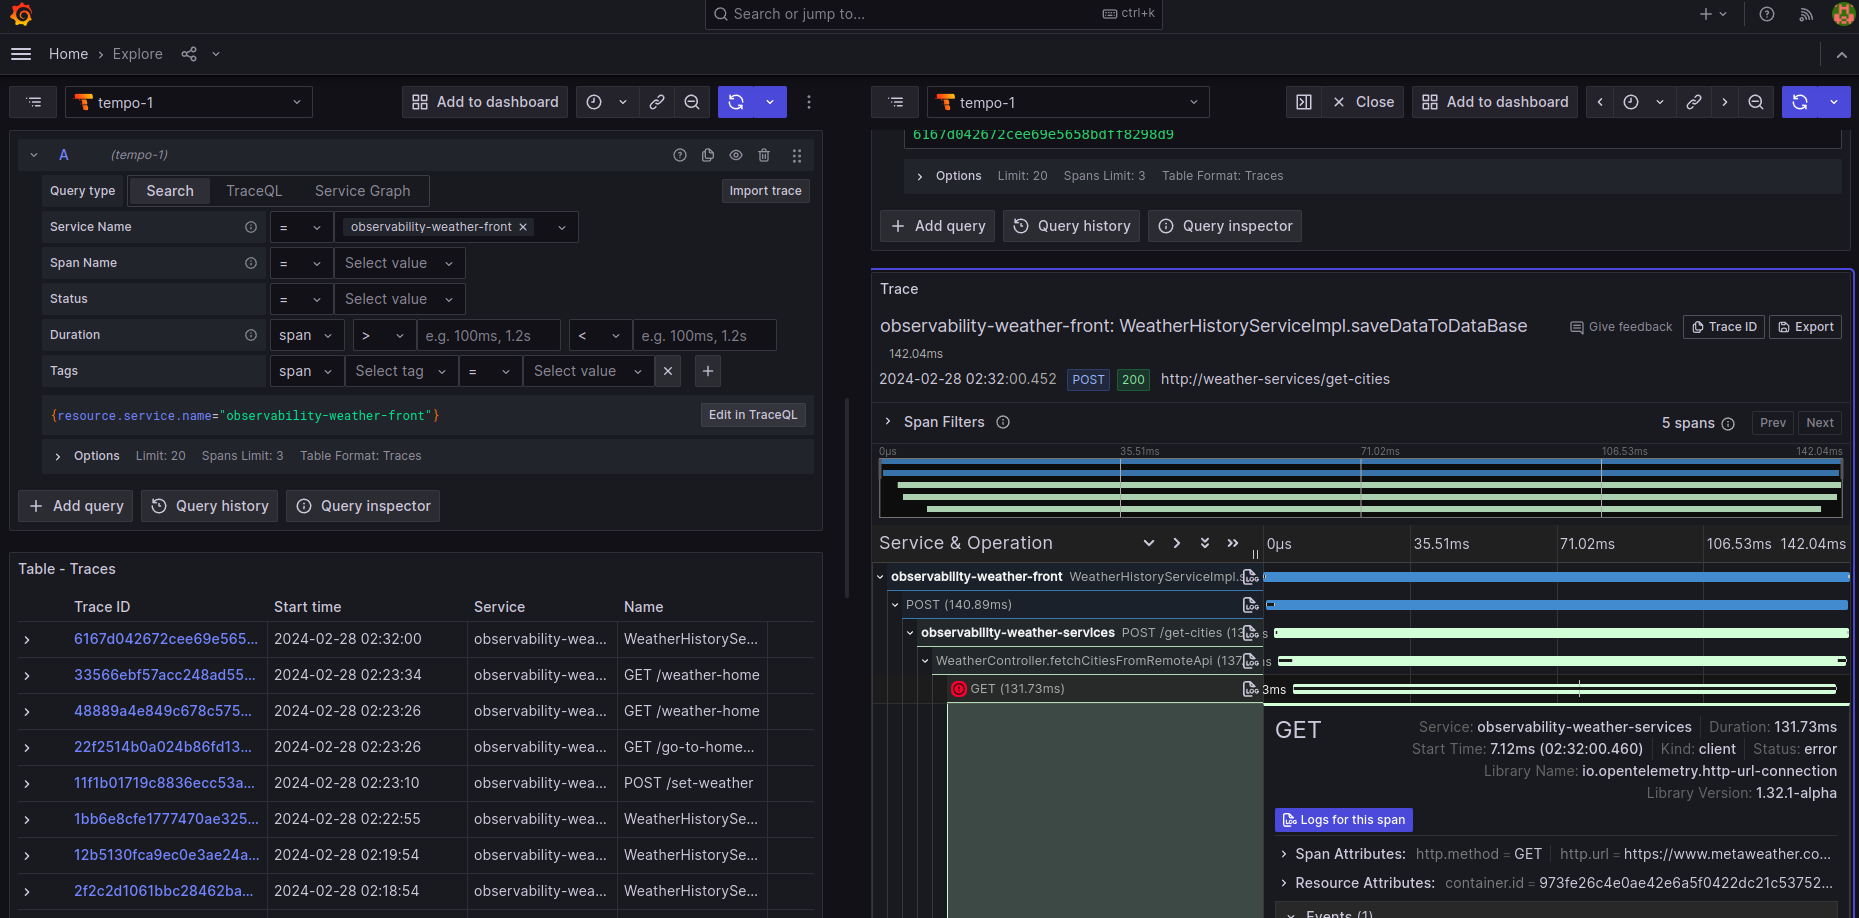 Trace the request across services using Tempo datasource
- Metrics: Prometheus, part of the kube-prometheus-stack, collects metrics on the number of requests, response times, and error rates. These metrics can be visualized in Grafana to monitor the health and performance of the weather service. For example, grafana dashboard (ID 17175) can be used to view Observability for Spring boot apps
- Logs: Logs generated by the weather service are collected by Promtail and stored in Loki. Grafana can query these logs, allowing you to search and visualize operational data. This is invaluable for debugging issues, such as understanding the cause of an unexpected spike in error rates.
- Traces: Traces captured by OpenTelemetry and stored in Tempo provide insight into the request flow through the weather service. This is crucial for identifying bottlenecks or failures in the service's operations.
Gaining Insights
With the weather application up and running, and observability data flowing, we can start to gain actionable insights:
- Performance optimization: By analyzing response times and error rates, we can identify slow endpoints or errors in the weather service, directing our optimization efforts more effectively.
- Troubleshooting: Logs and traces help us troubleshoot issues by providing context around errors or unexpected behavior, reducing the time to resolution.
- Scalability decisions: Metrics on request volumes and resource utilization guide decisions on when to scale the service to handle load more efficiently.
This weather service example underscores the power of OpenTelemetry in a Kubernetes environment, offering a window into the operational aspects of applications. By integrating observability into the development and deployment pipeline, teams can ensure their applications are performant, reliable, and scalable.
This practical example of a weather application illustrates the tangible benefits of implementing a comprehensive observability strategy with OpenTelemetry. It showcases how seamlessly metrics, logs, and traces can be collected, analyzed, and visualized, providing developers and operators with the insights needed to maintain and improve complex cloud-native applications.
Conclusion
Integrating OpenTelemetry with Kubernetes using tools like Loki, Tempo, and the kube-prometheus-stack offers a robust solution for observability. This setup not only simplifies the deployment and management of these tools but also provides a comprehensive view of your application's health, performance, and security. With the actionable insights gained from this observability stack, teams can proactively address issues, improve system reliability, and enhance the user experience.
Remember, the key to successful observability lies in the strategic implementation and continuous refinement of your monitoring setup. Happy observability!
Published at DZone with permission of Rajesh Gheware. See the original article here.
Opinions expressed by DZone contributors are their own.
Comments