‘Top’ Reporting Accurate Metrics Within Containers
“Top” may not accurately report information when executed within a Docker container. This post aims to bring this issue to your attention.
Join the DZone community and get the full member experience.
Join For Free“Top” is a robust, lightweight command-line tool that provides real-time reports on system-wide resource utilization. It is commonly available in various Linux distributions. However, we have observed that it may not accurately report information when executed within a Docker container. This post aims to bring this issue to your attention.

CPU Stress Test in Docker Container
Let’s carry out a straightforward experiment. We’ll deploy a container using an Ubuntu image and intentionally increase CPU consumption. Execute the following command:
docker run -ti --rm --name tmp-limit --cpus="1" -m="1G" ubuntu bash -c 'apt update; apt install -y
stress; stress --cpu 4'
The provided command performs the following actions:
- Initiates a container using the Ubuntu image
- Establishes a CPU limit of 1
- Sets a memory limit of 1G
- Executes the command ‘
apt update; apt install -y stress; stress –cpu 4’, which conducts a CPU stress test
CPU utilization reported by the top in the host
Now, let’s initiate the top tool on the host where this Docker container is operating. The output of the top tool is as follows:
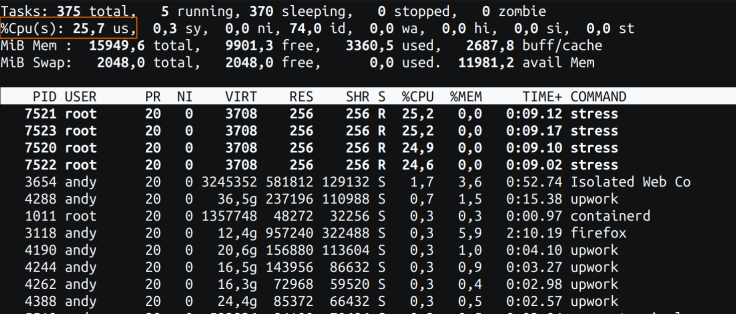 Fig 1: top command from the host
Please take note of the orange rectangle in Fig 1. This metric is indicated as 25% CPU utilization, and it is the correct value. The host has 4 cores, and we have allocated our container with a limit of 1 core. As this single core is fully utilized, the reported CPU utilization at the host level is 25% (i.e., 1/4 of the total cores).
CPU Utilization Reported by the Top in the Container
Now, let’s execute the top command within the container. The following is the output reported by the top command:
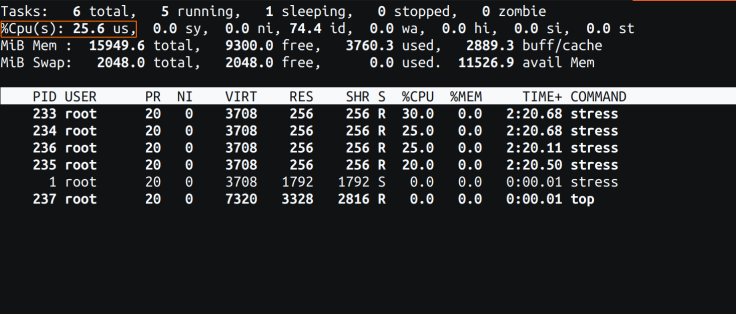 Fig 2: top command from the container
Please observe the orange rectangle in Fig 2. The CPU utilization is noted as 25%, mirroring the host’s value. This, however, is inaccurate from the container’s viewpoint as it has fully utilized its allotted CPU limit of 100%.
Nevertheless, it’s important to note that the processes listed in Fig 2 are accurate. The tool correctly reports only the processes running within this container and excludes processes from the entire host.
How To Find Accurate CPU Utilization in Containers
In such a scenario, to obtain accurate CPU utilization within the container, there are several solutions:
- Docker Container Stats (docker stats)
- Container Advisor (cAdvisor)
- yCrash
1. Docker Stats
The docker stats command provides fundamental resource utilization metrics at the container level. Here is the output of `docker stats` for the previously launched container:
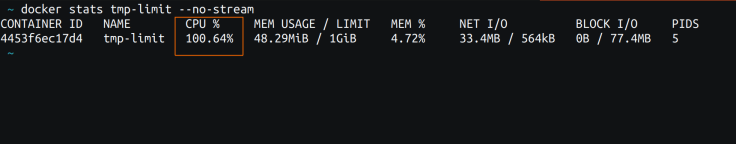 Fig 3: docker stats output
Note the orange rectangle in Fig 3. The CPU utilization is indicated as 100.64%. However, the challenge lies in the fact that `docker stats` cannot be executed within the container (unless the docker socket is passed into the container, which is uncommon and poses a security risk). It must be run from the host.
2. cAdvisor
You can utilize the cAdvisor (Container Advisor) tool, which inherently supports Docker containers, to furnish container-level resource utilization metrics.
3. yCrash
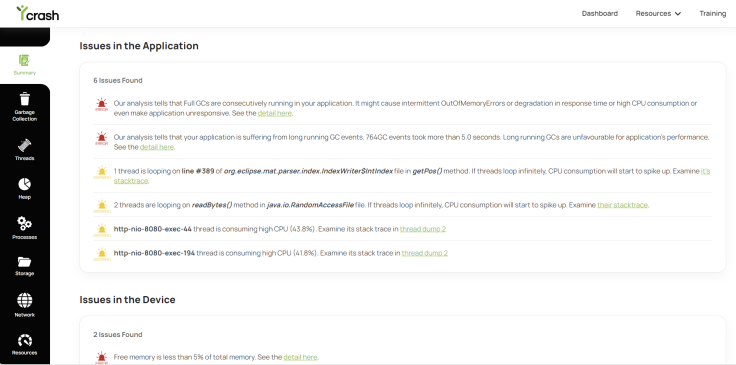 Fig 4: yCrash – root cause analysis report
Additionally, you have the option to employ the yCrash tool, which not only provides container-level metrics but also analyzes application-level dumps (such as Garbage Collection logs, application logs, threads, memory dumps, etc.) and presents a comprehensive root cause analysis report.
Conclusion
While “top” serves as a reliable tool for monitoring system-wide resource utilization, its accuracy within Docker containers may be compromised. This discrepancy can lead to misleading insights into container performance, especially regarding CPU utilization. As demonstrated in our experiment, “top” reported 25% CPU usage within the container despite full utilization of the allocated CPU limit.
To obtain precise metrics within Docker containers, alternative tools such as Docker Container Stats, cAdvisor, and yCrash offer valuable insights into resource utilization. By leveraging these tools, users can ensure accurate monitoring and optimization of containerized environments, ultimately enhancing performance and operational efficiency.
Published at DZone with permission of Ram Lakshmanan, DZone MVB. See the original article here.
Opinions expressed by DZone contributors are their own.
Comments