Understanding the Power of Coefficient of Variation in Software Performance Testing
How to use the Coefficient of Variation (CoV) metric in the analysis of your test results and how JMeter reports this statistic.
Join the DZone community and get the full member experience.
Join For FreeOh no! Not another figure to look at when analyzing performance test results! Most performance tools already report a bunch of them (e.g., average, min, max, percentiles...), which we have to review for our report; why add a new metric to the list?
Actually, the Coefficient of Variation (CoV) stands out as a valuable metric to prove that your application will perform reliably under various conditions. In this article, we will explore the benefits and usage of the CoV in software performance testing, specifically when measuring response times, and look at how it is reported in Apache JMeter.
What Is the Coefficient of Variation?
The Coefficient of Variation is a statistical measure used to assess the relative variability of data points in relation to their mean. In other words, it quantifies the consistency or stability of the dataset. It is expressed as a percentage and is calculated as:
CoV = (Standard Deviation / Mean) x 100
In the context of software performance testing, the CoV can provide invaluable insights into the stability of the response times. Let's see how.
Benefits of Using the Coefficient of Variation in Software Performance Testing
Detecting Variability
Response times in software applications can vary significantly due to a range of factors, including server load, network conditions, and code efficiency. The CoV helps in detecting if these response times are consistently stable or if they fluctuate widely. High CoV values indicate instability, while low CoV values suggest consistency.
The following figure shows two examples of samplers with a moderate CoV value of 20.66% and a high CoV value of 49.90%:

With the HighCov sampler, we can see that the response time is constantly bouncing between 50 to 600ms (not good), whereas the response times of the ModerateCov sampler vary between 50 to 100ms (acceptable).
Comparing Different Test Scenarios or Different Versions of the App
If you have to run the same tests under different conditions, such as various loads, hardware configurations, or app versions, then by analyzing the CoV of each scenario, you can easily compare their response time stability. This helps identify scenarios and/or versions where the application may struggle to maintain consistent performance.
Reporting of the CoV in JMeter
The Standard Deviation and Average values are already given in the Summary Report of JMeter. Then, you can manually calculate the CoV following the formulae given above with these values.
However, two new plugins, the Apdex and Coefficient of Variation and the Cohen's d Results Comparison plugins, will compute the CoV directly for you. The CoV values in the Apdex and CoV plugins will help you detect variability in the current application, whereas the CoV values in the Results Comparison plugin will help you compare the CoV of two different tests.
Setting CoV Pass/Fail Criteria
Furthermore, the Apdex and CoV plugin lets you define a maximum acceptable CoV threshold to ensure that the response times remain within an acceptable level of variability. If the CoV exceeds this threshold, it may indicate performance issues, and the test shall be marked as "failed."
When the CoV exceeds the acceptable threshold, it serves as an early warning sign that something may be wrong. You would then need to delve deeper to identify the root causes of the performance issues. This proactive approach to troubleshooting can save time and resources down the track.
Keep in mind that the CoV's significance depends on the context. A high CoV might be acceptable during a peak test but not during normal tests.
Specifying the Criteria for CoV Pass/Fail Testing
The specific value for pass/fail testing using the CoV can vary depending on the nature of the application and the expectations of its users. However, here are some general guidelines to consider:
- Establish a Baseline: Start by establishing a baseline CoV value during normal operating conditions. This can help you set realistic thresholds and can serve as a reference point for future testing.
- Define an Acceptable Range: as a starting point, the following table provides a general indication of what might be considered low, moderate, and high CoV values:
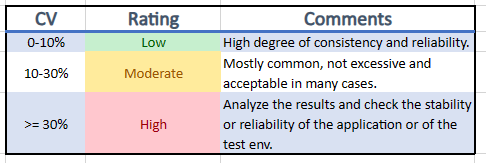
However, it's important to note that the specific thresholds should be tailored to your application, user expectations, and performance goals. What is considered an acceptable or high CoV can vary widely depending on the nature of the software and its criticality. Here are some considerations:
- Application Type: Different types of applications may have different tolerance levels for variability. For example, a real-time financial trading platform might require a lower CoV threshold compared to a less time-sensitive application.
- User Expectations: Consider what your users expect in terms of performance. Are they sensitive to variations in response times, or are they more forgiving? Align your CoV thresholds with user expectations.
- Impact on Business: Assess the potential impact of high CoV values on your business. If variability in response times leads to customer dissatisfaction or lost revenue, you may want stricter CoV thresholds.
- Test Scenarios: Adjust CoV thresholds based on the specific test scenarios. For example, you might allow for higher variability during stress testing when the system is intentionally pushed to its limits.
- Regulatory Requirements: If your software is subject to regulatory standards, ensure that your CoV thresholds comply with those requirements.
Conclusion
The Coefficient of Variation is a powerful tool that you should add to your software performance testing, particularly when measuring response times, as an excess of the variability of the response times will directly impact the user experience. By incorporating the CoV into your testing, you can ensure that your software applications deliver consistent and reliable performance, enhancing user satisfaction and trust in your product.
Opinions expressed by DZone contributors are their own.
Comments